Patient Response Time Dashboards
- Get Started
- Troubleshooting and FAQ
- Release Notes
- Patient Channel
- Triggers
- Technical Specifications
- Patient Facesheet
- Insights & Analytics
- Conversation Flows
- Campaigns
- SMS Basics
- Inbox
- Lines & Resources Requests
- Lines, Events, Resources
- Referrals
- AI Agents
- Add-Ons
- Users and Groups
- Platform Settings and Configuration
- Self-Rescheduling
- Recalls
- Artera Harmony Federal Edition
- Marketplace
Patient Response Time (PRT) measures how long a Patient Channel remained in an "open" status before it was closed. This helps you understand how fast patients receive responses to their messages.
What Do PRT Dashboards Measure?
PRT measures the time elapsed between an "open" to "closed" Patient Channel and tracks how long patients wait for a response when your Practice is considered open. For reference, a Patient Channel will change to an "open" status when a patient sends a message and will auto-close when a manual message is sent back to the patient by a user.
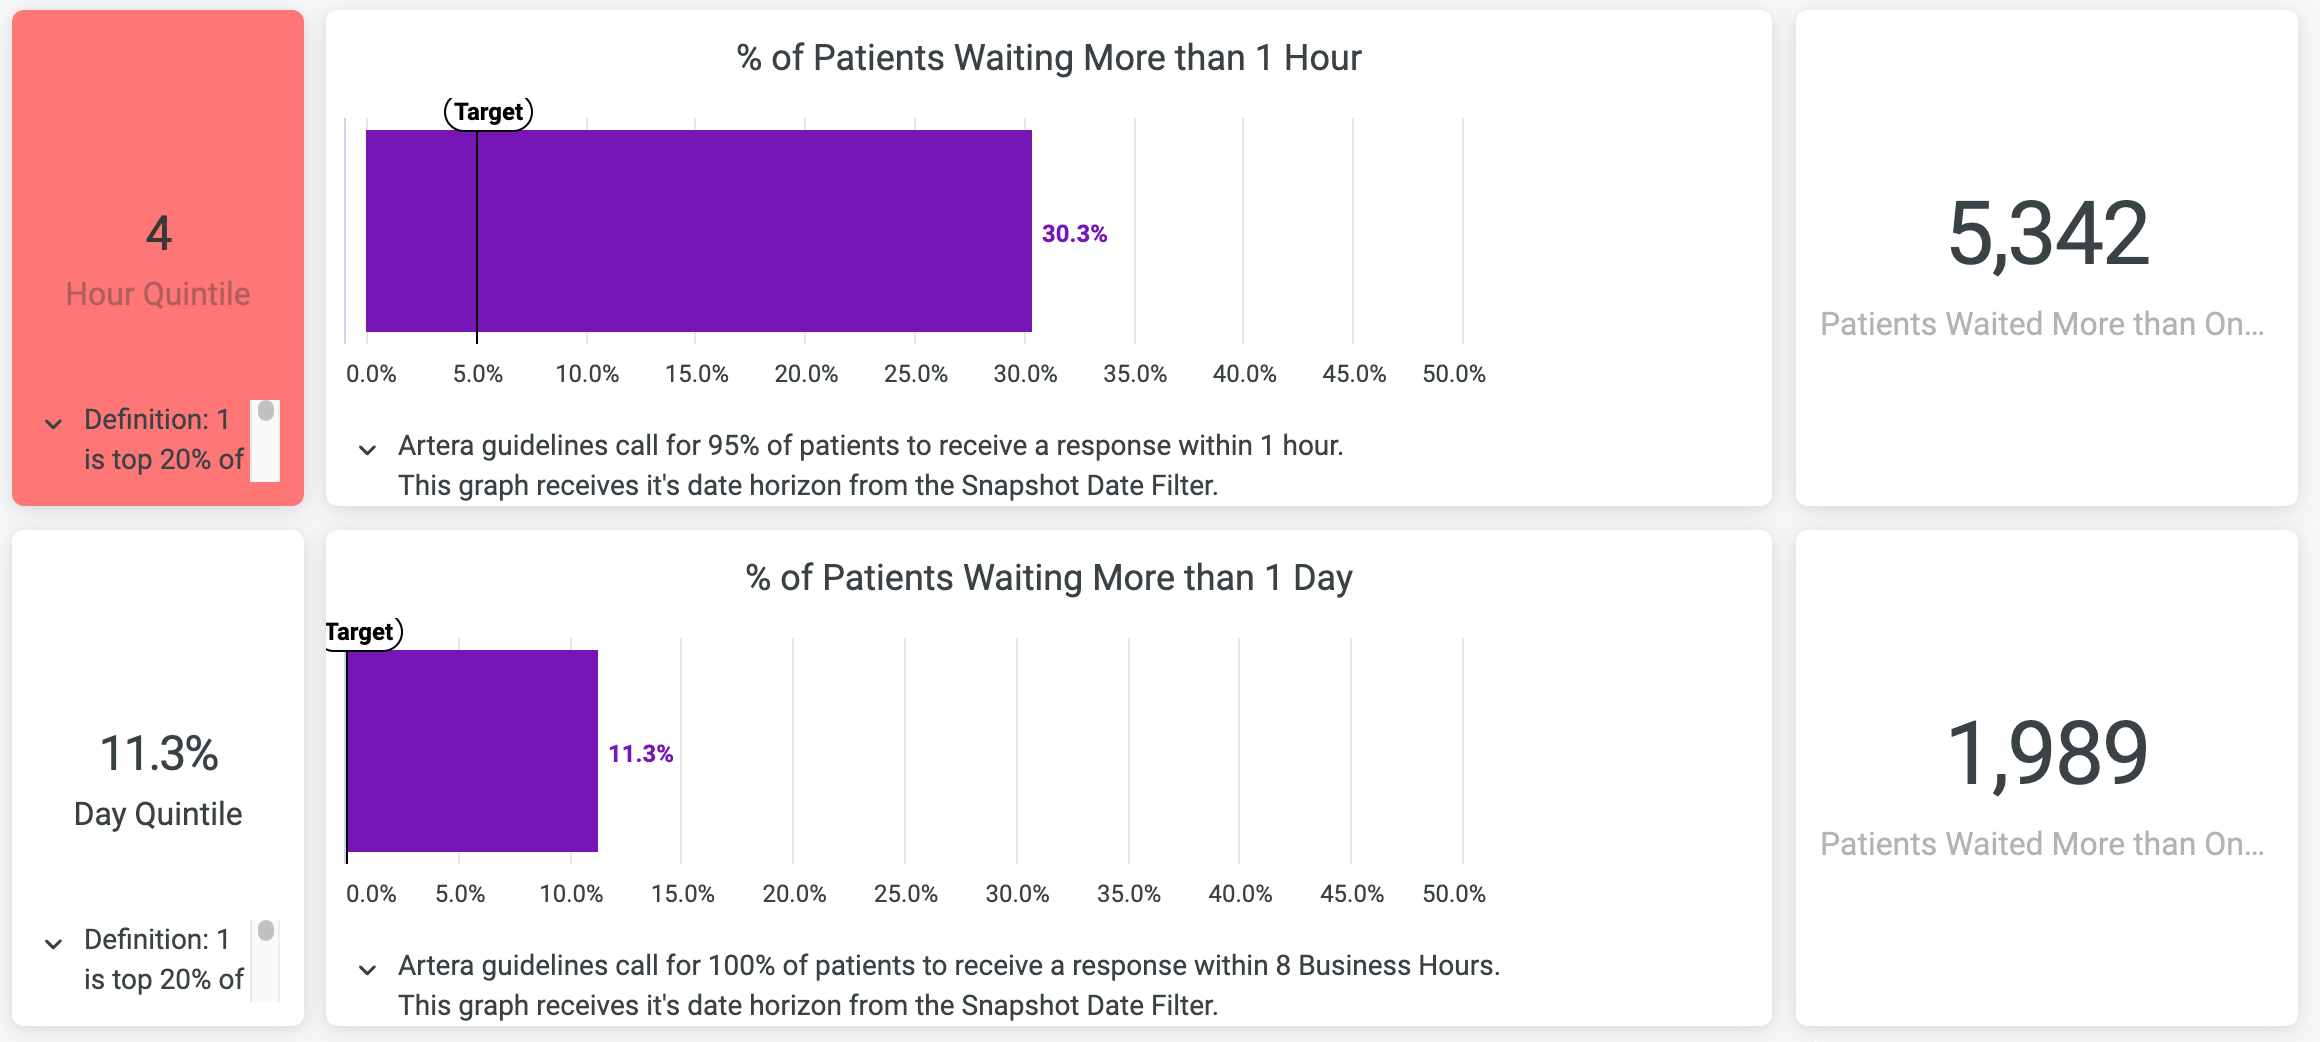
% of Patients Waiting More Than One Hour: This displays how many Patient Channels took more than 60 minutes to change to a "close" status. We recommend a goal of 5% or less. If this value is higher than preferred, consider how workflows can be improved and what Inbound Keyword Triggers can be added to give instant responses.
% of Patients Waiting More Than One Day: This displays how many Patient Channels were in an "open" status for more than 8 business hours. We recommend a goal of 0% for this metric. Artera functionality can be used to automate responses, where appropriate, to keep this value low. If this value is higher than preferred, consider ways to automate workflows using Triggers and evaluating staff processes to explore opportunities for improvement.
Hour/Day Quintiles: Quintiles compare your PRT to all Artera customers. Ranking within the first quintile means that you are in the top 20% of fastest response times. The second quintile equates to the top 40%, and so on. The smaller the quintile score, the more impressive the PRT.
Date Range
All Practice Analytics dashboards display data collected from the past two weeks, while Enterprise Analytics dashboards allow for custom date ranges to be selected using the date filter at the top of the report.
PRT Calculation
The following details are helpful for understanding how PRT is calculated.
Channel Status
The data only displays Patient Channels that go from an "open" to "closed" status. The timer starts the moment the Patient Channel status is set to "open" and stops when it changes to "closed". The duration a Patient Channel spends in a "Needs Action" status is not included in the PRT calculation.
Multiple Inbound Messages
If a patient sends multiple messages before receiving a response, the PRT is calculated from the time from the first message that the patient sent until the Patient Channel is closed.
Business and Holiday Hours
This calculation takes into account Business Hours (set at the Practice or line-level) and Holiday Hours (Set at the Enterprise, Practice, and line levels). Any Practice that is missing business hours is automatically assigned default hours of 9:00 AM-5:00 PM in the Practice's local timezone for our calculations. This ensures PRT is tracked consistently across all Practices.
However, many Practices that are missing hours are Customer Notifications or SendMessage API Practices, which typically are not used for patient messages. As these Practices appear in the PRT Dashboard, this may increase the number of patients shown as waiting more than one hour or more than one day for a response. Therefore, if a Practice is not used for conversational messaging, its Practice Hours should be set to 1:00 AM-1:01 AM. As a short-term solution, you can also filter these Practices out of PRT dashboards.
Additionally, the calculation respects the My Practice is open on this holiday toggle, which will override holiday hours for the Enterprise, and the My Line is open on this holiday toggle, which overrides holiday hours for the Enterprise and Practice.

Business and Holiday Hours Logic
Business Hours in Artera are calculated by checking if line hours exist. If Line hours exist, those are honored, if not, Artera defaults to using the Practice Hours.
Holiday Hours are calculated by checking if a line-level holiday exists, then if a Practice holiday exists, and then if an Enterprise holiday exists. If a holiday exists, it will integrate into the Business Hours. If a line’s business hours are from 8:00-17:00 and there is a holiday which is 12:00-17:00, the line is still open from 8:00-12:00.