Self Service Analytics Explores
- Get Started
- Release Notes
- Triggers
- Patient Channel
- Troubleshooting and FAQ
- Patient Facesheet
- Technical Specifications
- Insights & Analytics
- Inbox
- Conversation Flows
- Campaigns
- Lines & Resources Requests
- Lines, Events, Resources
- SMS Basics
- Referrals
- AI Agents
- Add-Ons
- Users and Groups
- Platform Settings and Configuration
- Self-Rescheduling
- Recalls
- Marketplace
- Artera Harmony Federal Edition
Table of Contents
Video DemoHow to Access ExploresAppointment Details Message Details AutomationsCampaignsChannel State HistoryChatAssist AIEncounterLink TrackingMentionsOpt-Outs and Opt-InsRecallReferralUsersArtera PatientsArtera Analytics Explores serve as a starting point for data exploration. To customize a report to meet your organization's data needs, use an Explore as a starting point.
Video Demo
How to Access Explores
Log in to Looker
Select the Explores tab located on the left sidebar of the screen:
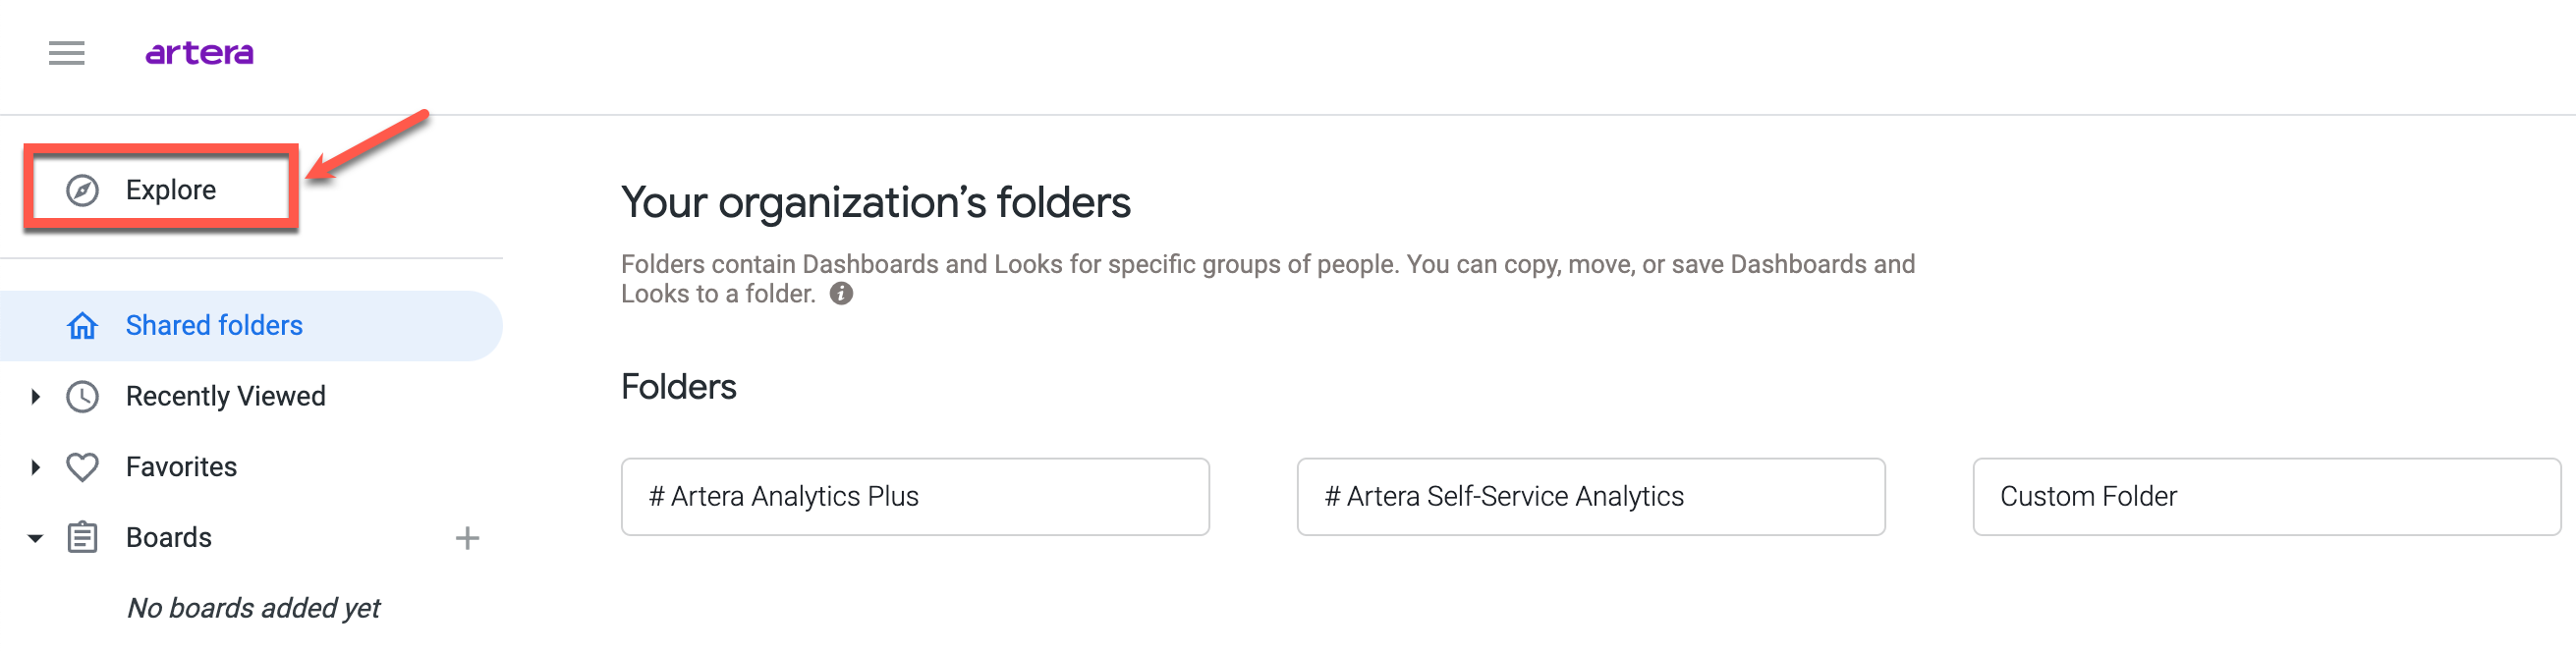
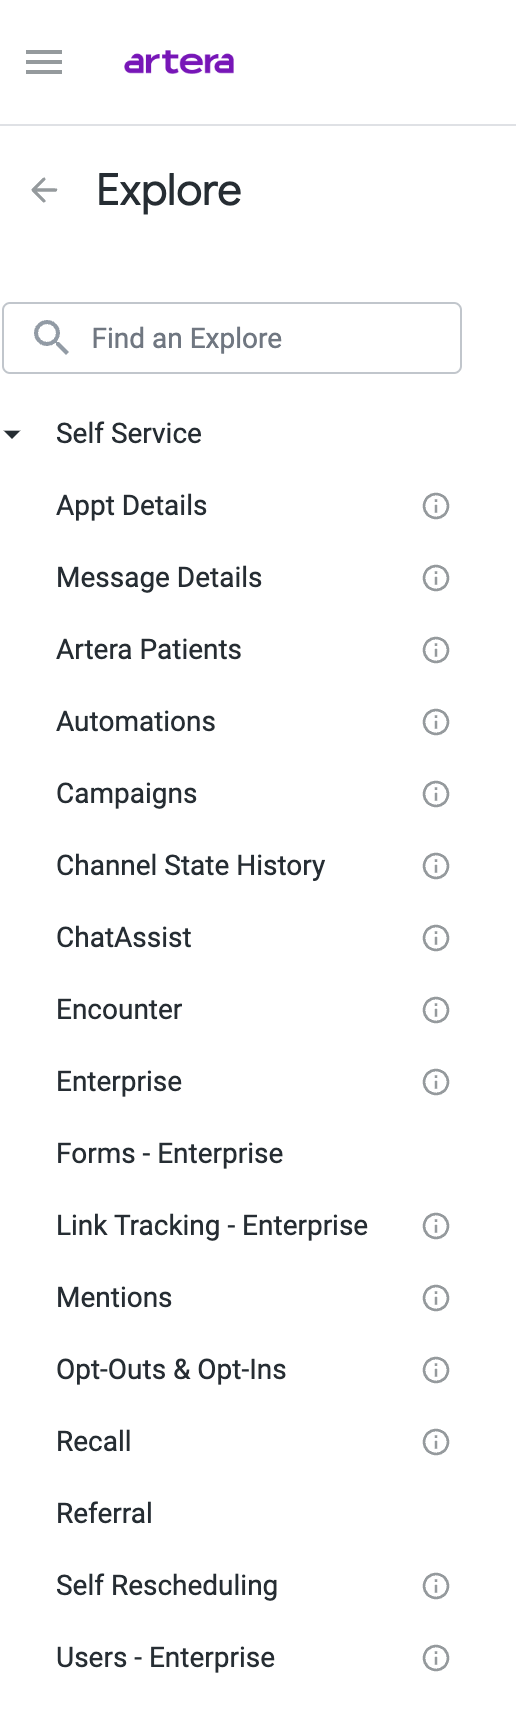
Choose a Self Service Explore. See Artera Explores below for information on each Explore.
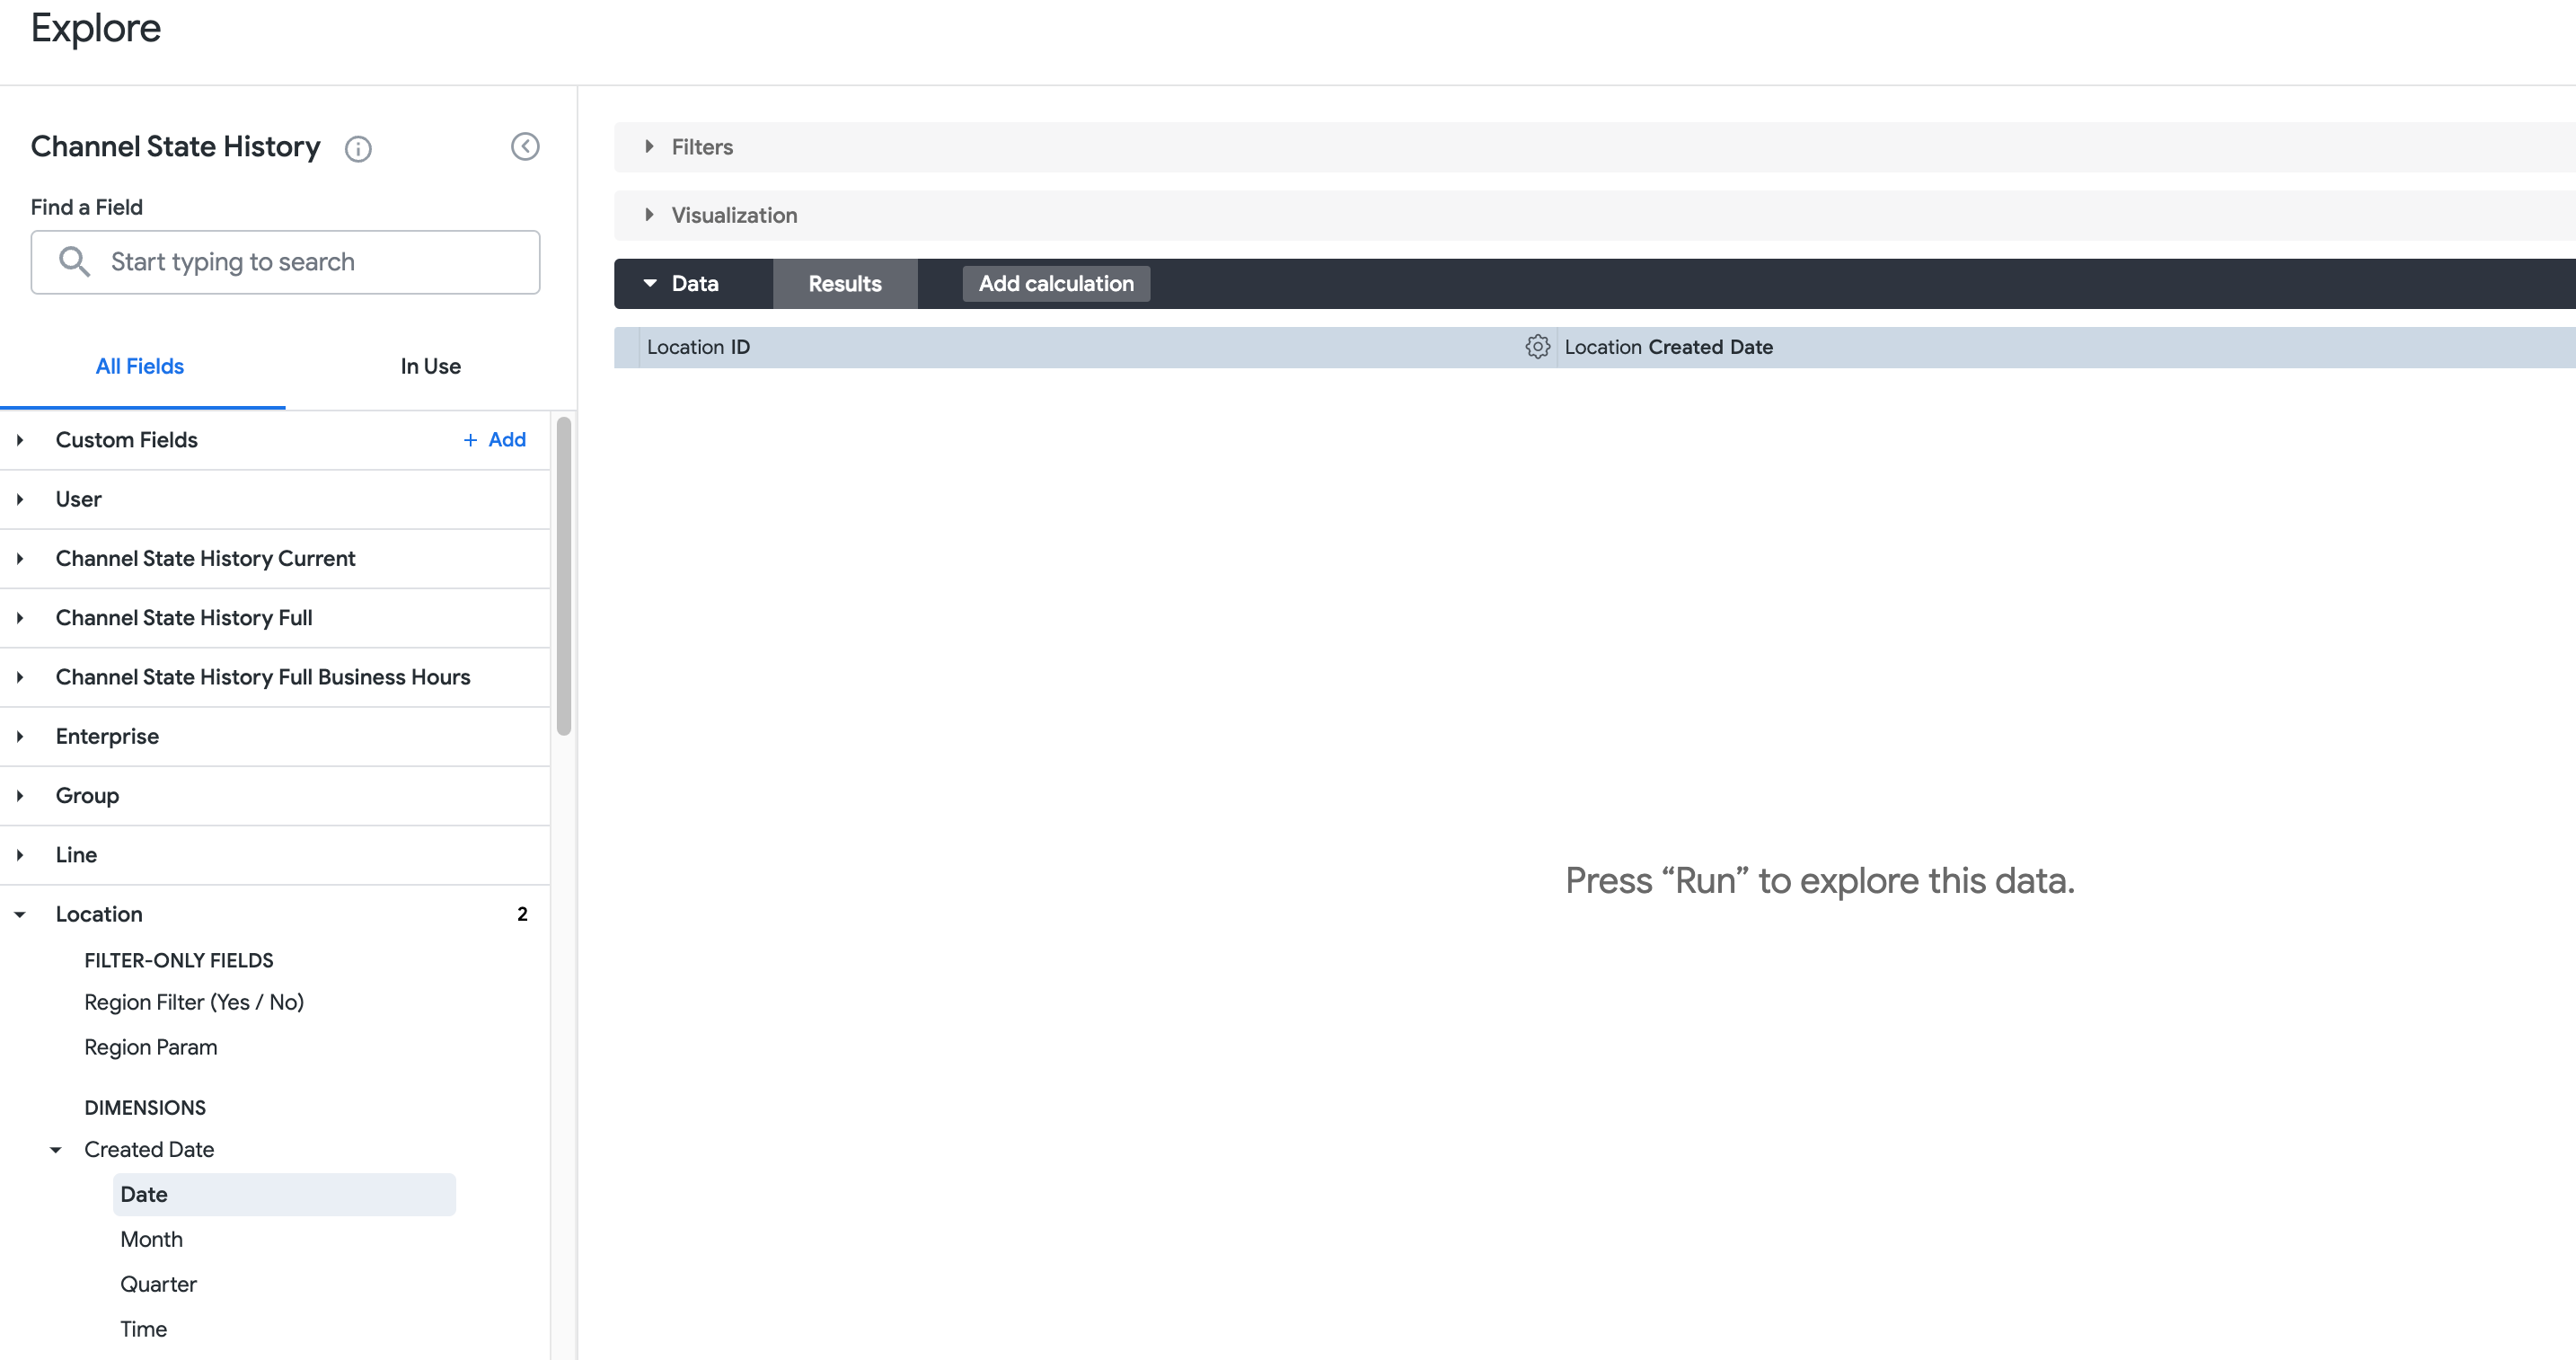
From the All Fields tab, select the fields (data categories) you wish to include in the report
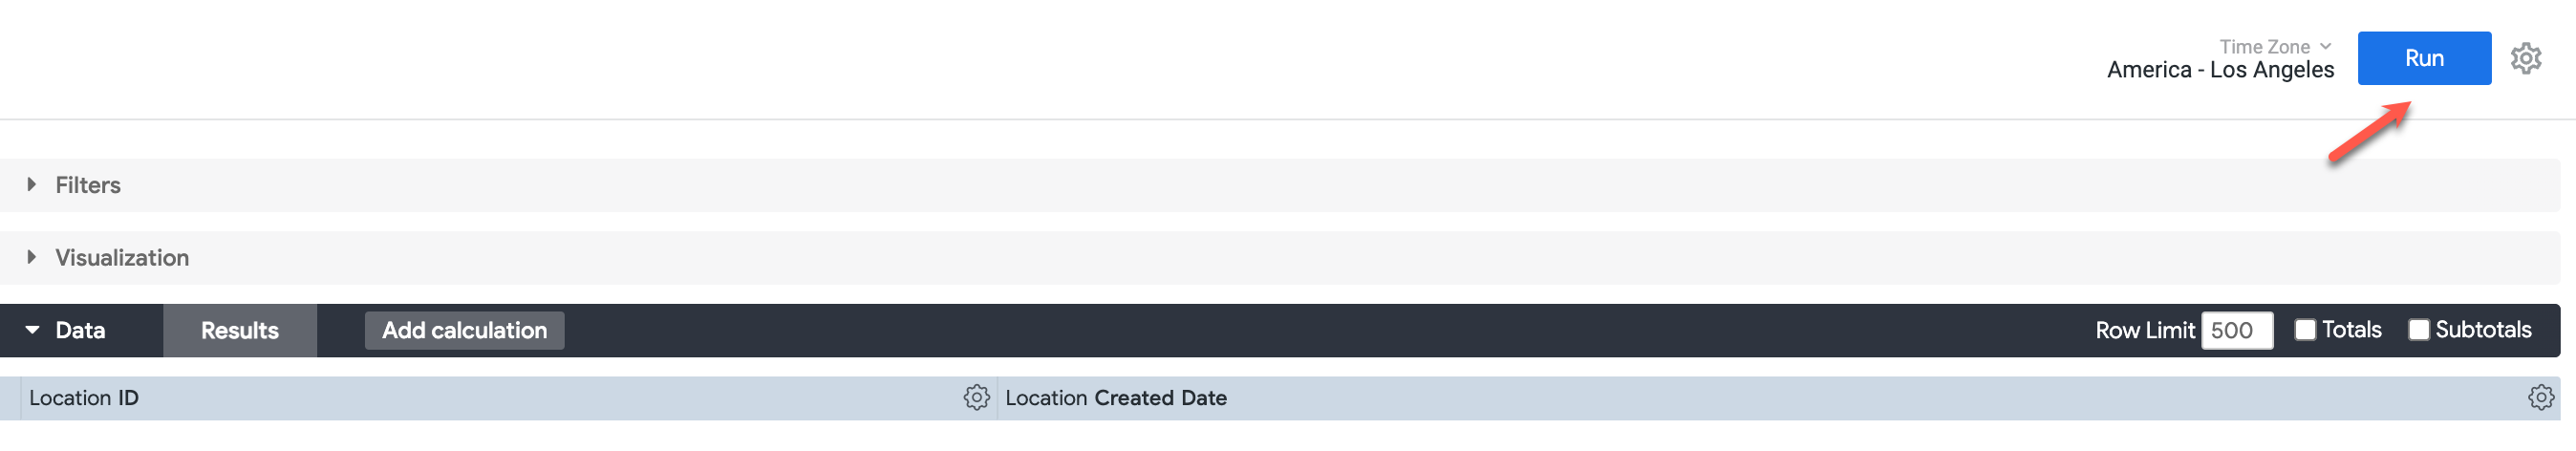
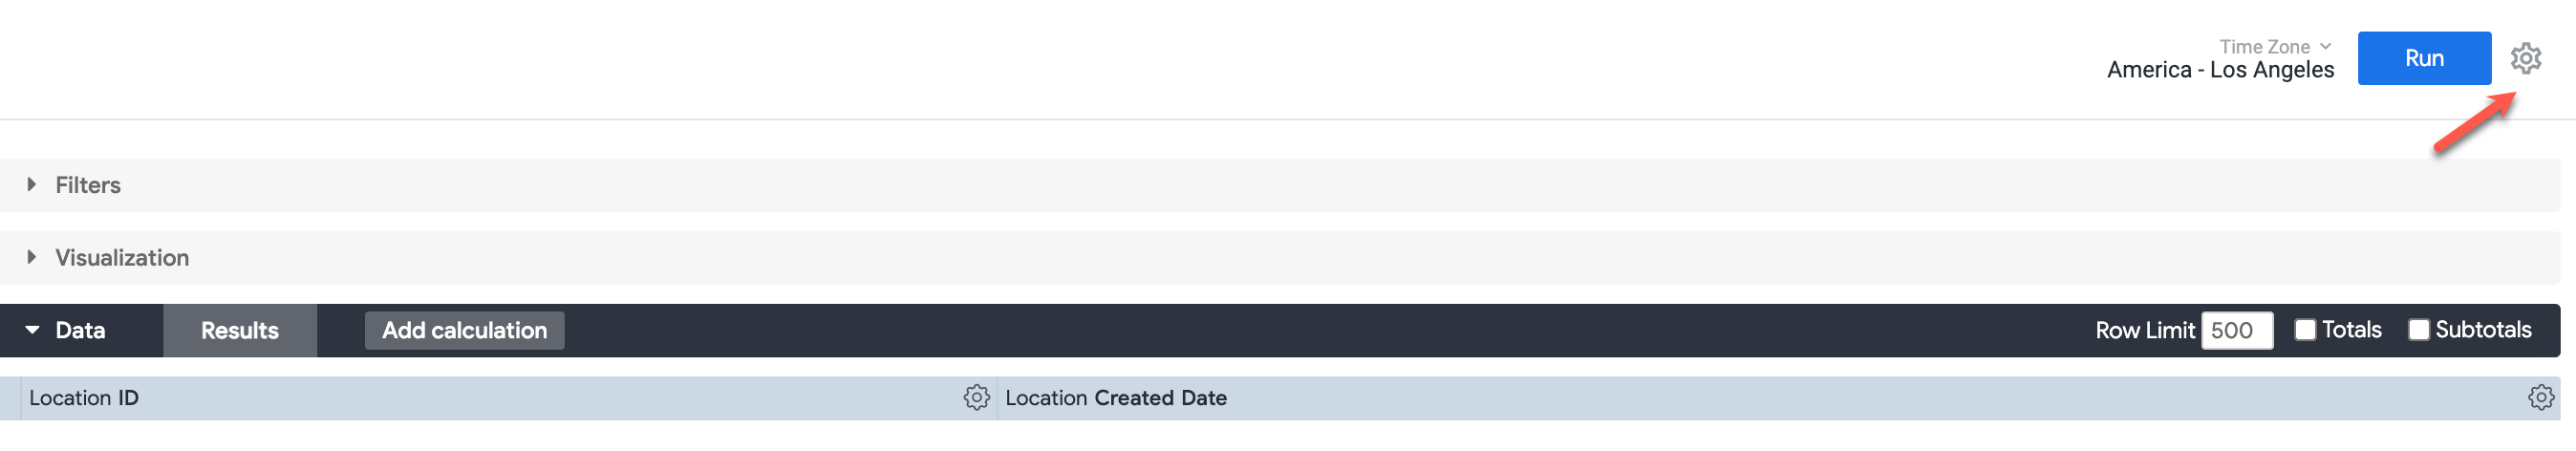
Once all fields have been selected and included in the report, Run the report to explore the data you wish to report on
If the report meets your organization's data needs, save the report for future use:
- Select the settings gear in the top-right corner of the page
- Choose Save > As a New Dashboard, To an Existing Dashboard, or As a Look
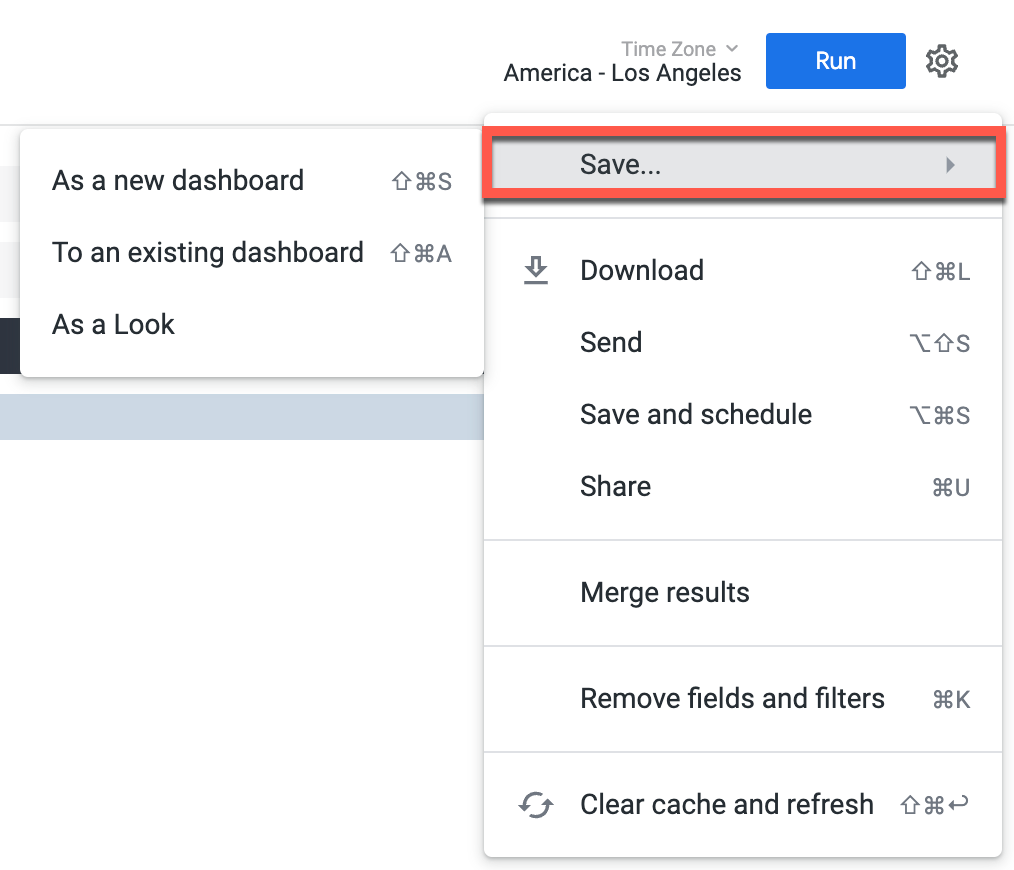
-
Provide the new Dashboard or Look with a Title
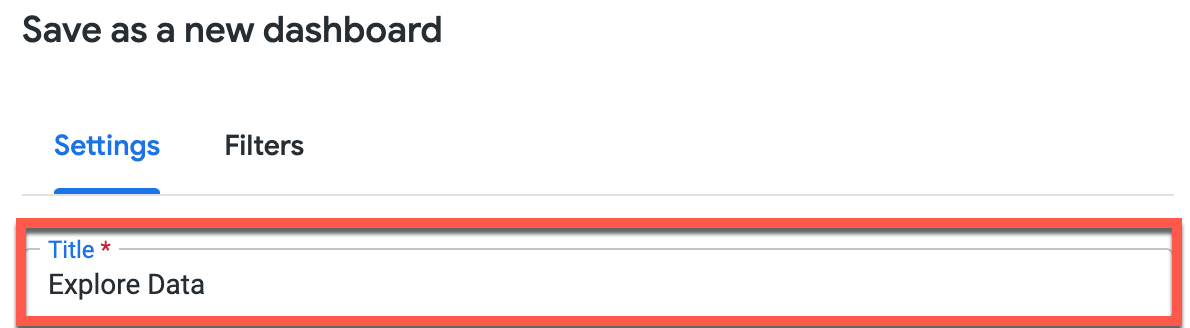
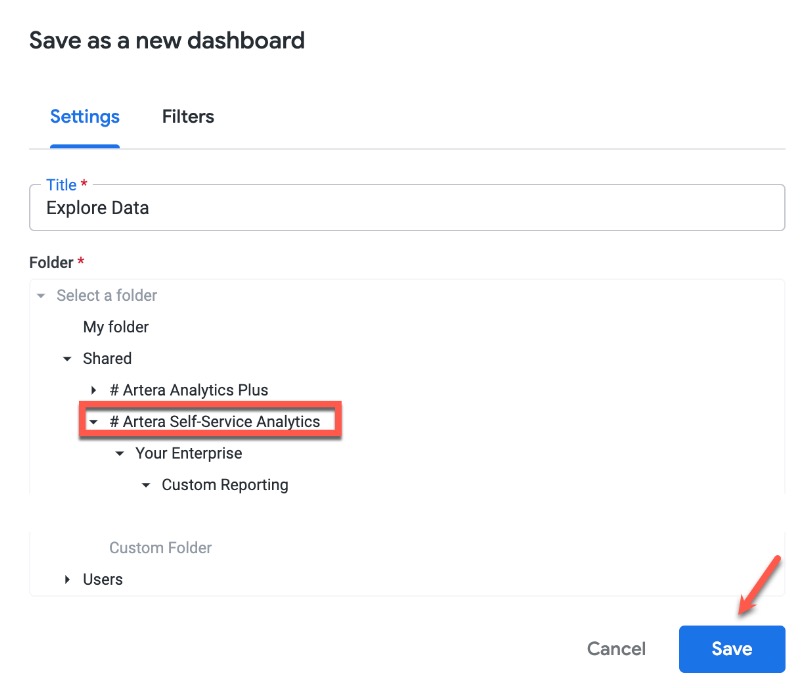
- Select the Shared tab and choose Artera Self Service Analytics
- Select your Enterprise
-
Choose Custom Reporting and click Save
Artera Explores
Review the available Explores below to better understand the various data points available in Self Service Analytics.
Appointment Details
The Appointment Details Explore contains data relating to appointments. Examples of data categories included in the Appointment Details Explore are:
Metrics related to Automated or Manual Appointment Messages such as message text, reach, engagement, response-time, and effectiveness, confirmations, message type (sms vs. email), delivery status, and sent time
Appointment Category
Appointment Status History
Appointment Time Converted
Appt Request data for appointment reminders that solicit appointment response options from the patient (confirm, cancel, view, unconfirm, reschedule).
Automation Current: Appointment Automation Data that reflects configurations in the app such as smart-phrases, descriptions, Email vs. sms, filters, and status.
Practice Hours
Clientpii (Appointment general patient information)
Location (Location appointment scheduled in)
Practice (Practice appointment scheduled in)
Provider (Provider of appointment)
Appointment ID Mapping Between Artera and EMR System
NoShow Standouts
Example reports and Dashboards that use the Appointment Details Explore can be found in the Artera Analytics Plus folder:
Appointment Reach Detail
No Show Trends
Executive Dashboard V2
Message Details
The Message Details Explore contains data relating to all messages. Some examples of data categories that can be found in the Message Details Explore are:
Metrics related to Automated Messages such as the automation that triggered a message and the app configurations associated with the message automation.
Metrics related to Manual Messages such as the user who sent the message, details regarding the last automated message that was sent before a manual message, and the message text.
Campaign
Carriers - Destination
Carriers - Origin
Message Type
User (Both Patient and Agent Details)
Language of Message
Message Errors (Inbound SMS, Outbound Delivery Status)
Message Time
Line (Phone Line used to send message)
MessageMetaData Recall IDs
Message Inbound vs Outbound, and relationships to specific Recalls, \Appointments, Campaigns, Channels, Practices and links
Message Responses (about Inbound, to Outbound)
Example reports and Dashboards that use the Message Details Explore can be found in the Artera Analytics Plus folder:
Deliverability Dashboard V1.1
Executive Dashboard v2
Inbound Message Volume
Manual Messaging
Patient Message History
Undelivered Messages
Undelivered Messages by Practice and Line
Wrong Number Inbound Messages
Inbound Keyword Automation
Inbound Keyword Report
Automations
The Automations Explore contains data relating to all Automations, particularly the metadata associated with an Automation. This comes from the content and configuration of the Automation within Artera. Some examples of the data categories that can be found in the Automation Explore include:
Automation Status (including status changes)
Automation Description
Automation History & Versions including created date, updated date, and specific changes to an existing Automation.
Automation configuration metadata pertaining to the Automation Module (Referral, Appointment, Recall, etc.)
Automation Media and Links
Templates
Automation Patient Demographic and General Data
Automation Events - for reporting on Event Types that are configured to trigger specific Automations within your current settings (e.g. telehealth visit, new patient, procedure, etc.)
Message Text
Mmd Delivery Status
Automation by Practice
Response - Keyword Trigger
Example reports and Dashboards that use the Automations Explore can be found in the Artera Analytics Plus folder:
Full Automations Breakdown
Deliverability by Automation
Campaigns
The Campaigns Explore contains data relating to Campaigns. Some examples of data categories that can be found in the Campaigns Explore are:
Users
Appointments
Patients
Status
Campaign metadata like history, description, start times, end times, and created date
Campaign Opt-Outs
Clientpii Reached (patients reached)
Response (Inbound responses from patients)
Outbound Delivery Status
Message Text
Carrier IDs Destination and Line Details
Campaign Practice Details
Example reports and Dashboards that use the Campaigns Explore can be found in the Artera Analytics Plus folder:
Campaign Effectiveness v2
Campaign Delivery
Campaign Responses
Campaign Patients with Undelivered Outreach
Patient Opt Outs To Campaigns
Channel State History
The Channel State History Explore contains data relating to Patient Channel status changes over time. Some examples of data categories that can be found in the Channel State Explore are:
Channel metadata such as links, current state, previous state, and updated date
Channel Link
User (Artera users in Patient Channel)
Patient Details
Pinned Patient
Patient Response Time
Channel Open Time
Channel State History
Practice
Practice Hours
Line (Phone Lines used to communicate in Patient Channel)
Location
Example reports and Dashboards that use the Channel State History Explore can be found in the Artera Analytics Plus folder:
User Activity
Build Report
Patient Response Time Dashboard v2.3
ChatAssist AI
The ChatAssist AI Explore contains data relating to ChatAssist AI performance and KPIs over time. Examples of data categories that can be found in the ChatAssist AI Explore are:
Appointment Conversations
Conversation Context
Patients
ChatAssist AI First Message Context
Decision Tree Logic
Expiration Messages
Practice
Inbound Messages
There are no reports or Dashboards currently in the Artera Analytics Plus folder that use the ChatAssist AI Explore.
Encounter
The Encounter Explore contains data relating to Encounters like Post-Discharge, Admissions, and Transfers. Some examples of data categories that can be found in the Encounter Explore are:
Encounter Patient Info (Clientpii)
Encounter Type Details
Encounter Diagnosis
Encounter Procedure
Practice
There are no reports or Dashboards currently in the Artera Analytics Plus folder that use the ChatAssist AI Explore.
Link Tracking
The Link Tracking Explore contains data relating to Secure Link-Related metrics. Examples of data categories that can be found in the Link Tracking Explore are:
Link Engagement like Click Count and Clickthrough Rates
Automation (Link engagement by Automation)
Campaign (Link engagement by Campaign)
Practice (Link engagement by associated Practice)
Type (Link engagement by Type)
Location (Link engagement by associated Location)
Link Message Context
Responses
Link Sent Status
Example reports and Dashboards that use the Channel State History Explore can be found in the Artera Analytics Plus folder:
Link Clickthrough Rate
Automation Link Tracking Report
Mentions
The Mentions Explore contains data relating to Mentions. Some examples of data categories that can be found in the Encounters Explore are:
User - Creator
User - Receiver
User - Resolver
Mentions as they relate to patients within a conversation
Mentions Messages
Group (Mention by User Group)
Line (Mentions by Phone Line)
Practice (Mentions by Practice)
Example reports and Dashboards that use the Mentions Explore can be found in the Artera Analytics Plus folder:
Mentions Dashboard
Opt-Outs and Opt-Ins
The Opt-Outs and Opt-Ins Explore contains data relating to Opt-Out/Opt-Ins to SMS. Some examples of data categories that can be found in the Opt-Outs and Opt-Ins Explore are:
Clientpii (Opt-Out/Opt-In Details for patients who opted out/in to texts)
Practice (Opt-Out/Opt-In Details by Practice)
Opt-Out/Opt-In following specific messages
Line (Opt-Out/Opt-In by Phone Line)
Opt-Out Short Code
Example reports and Dashboards that use the Opt-Outs and Opt-Ins Explore can be found in the Artera Analytics Plus folder:
Opt Outs
Patient Opt Out
Recall
The Recalls Explore contains data relating to Recalls. Some examples of data categories that can be found in the Recalls Explore are:
Recall Matching to Rule
Recall Messages
Automations Current (Recall Automations)
Outbound Delivery Statuses
Recall Events
Recall metadata like created and updated dates, statuses, schedule dates etc.
There are no reports or Dashboards currently available in Artera Analytics Plus that use the Recall Explore.
Referral
The Referral Explore contains data relating to Referrals. Some examples of data categories that can be found in the Referral Explore are:
Referrals Diagnosis
Referral Types
Referral Responses (Accept, Decline, No Response)
Referral by Location
Referral by Provider
Referral to Provider
Referral Authorization
Specialty
Practice
There are no reports or Dashboards currently available in Artera Analytics Plus that use the Referral Explore.
Users
The User Explore contains data relating to users in Artera. Examples of data categories that can be found in the Users Explore are:
Practice (User by Practice)
User Activity
Resource
User Group Details
Examples reports and Dashboards that use the User Explore can be found in the Artera Analytics Plus folder:
User Activity
Artera Patients
The Artera Patients Explore contains data relating to Artera patients who have been successfully loaded into Artera. Examples of data categories that can be found in the Artera Patients Explore are:
Patient Contact Info Updates
Clientpii (General patient information)
Bad Patient Numbers by Enterprise
There are no reports or Dashboards currently in Artera Analytics Plus that use the Artera Patient Explore.